A Comparison of the Ovulation Method With the CUE Ovulation Predictor in Determining the Fertile Period
Abstract: The purpose of this study was to compare the CUE Ovulation Predictor with the ovulation method in determining the fertile period. Eleven regularly ovulating women measured their salivary and vaginal electrical resistance (ER) with the CUE, observed their cervical-vaginal mucus, and measured their urine for a luteinizing hormone (LH) surge on a daily basis. Data from 21 menstrual cycles showed no statistical difference (T = 0.33, P = 0.63) between the CUE fertile period, which ranged from 5 to 10 days (mean =6.7 days, SD =1.6), and the fertile period of the ovulation method, which ranged from 4 to 9 days (mean = 6.5 days, SO = 2.0). The CUE has potential as an adjunctive device in the learning and use of natural family planning methods.
The ability to avoid or achieve pregnancy is important for regulating birth rates at the individual, family, and population levels. To help achieve this end, a number of technological devices have been and are being developed. These devices include electronic and computerized basal body temperature, hormonal test kits, cervical-vaginal fluid volume meters, and crystallization monitors (Fehring, 1991). Of these techniques, the most practical ones are those that are accurate, safe, and inexpensive and can be used at home for self-monitoring.
A relatively new device that has been developed to aid in the prediction and detection of ovulation is the CUE Ovulation Predictor (Zetek Inc., Aurora, CO). The CUE consists of a handheld digital monitor with vaginal and oral sensors (see Fig. 1). The sensors detect and record the electrical resistance of salivary and vaginal secretions. The electrical resistance and ionic concentrations in both the saliva and vaginal-cervical secretions change in response to the cyclical changes in estrogen. The CUE Ovulation Predictor can be used to both predict and confirm ovulation. The peak value in salivary electrical resistance (SER) when using an oral probe occurs 5 to 7 days before ovulation, and the nadir, the lowest point of vaginal electrical resistance (VER) when using a vaginal probe, occurs approximately 1 day prior to ovulation. Use of the monitor requires daily morning measurements.
Theoretically, the SER is an indirect measure of the estrogenic effects of the dominant follicle on adrenocorticotropic hormone (ACTH) and aldosterone levels (Fernando, Regas, & Betz, 1988a). As the dominant follicle develops in each menstrual cycle, the levels of ACTH and aldosterone cause the increased production of NaCl. This increase in NaCl is reflected in salivary and vaginal secretions. The nadir in vaginal resistance occurs when the highest concentrations of NaCl are in the cervical mucus. This nadir is thought to coincide with ovulation. The lowest levels in NaCl production are reflected in the peak of SER which occurs about 5 to 7 days before ovulation.
Over the last 10 years, a number of studies have been conducted to determine the usefulness and accuracy of the CUE Ovulation Predictor. These studies used either the luteinizing hormone (LH) surge in the urine or serum as a comparison marker of fertility. Most of the early studies on the CUE Ovulation Predictor emphasized its role in aiding infertility treatment and artificial insemination. Albrecht, Fernando, Regas, and Betz (1985) found in 18 menstrual cycles from 13 women that the peak in LH occurred consistently 4 to 5 days after the peak measurement in SER and that the SER had a strong positive correlation (r = 0.94) to the LH surge. Fernando, Regas, and Betz (1988b) had similar findings with 23 women and 32 menstrual cycles. They found the SER to be 5 to 7 days before the serum LH surge and that a strong positive correlation existed (r = 0.94) between the SER and the LH surge. Both Albrecht et al. (1985) and Fernando et al. (1988b) mentioned the potential use of the CUE for natural family planning (NFP).
Moreno et al. (1988) conducted the first study to test the CUE Ovulation Predictor for its potential use in NFP. They analyzed 29 menstrual cycles from 11 women and found that the peak salivary resistance occurred 5 to 11 days before the estimated day of ovulation (i.e., estimated by the urine LH surge) in all 29 cycles. They noted that the VER nadir occurred within 2 days before the estimated day of ovulation in 93% of the cycles. The VER had a strong positive correlation (r = 0.79) with the estimated day of ovulation. The VER occurred after the estimated day of ovulation in only one cycle. Roumen and Dieben (1988), however, found no strong correlation between the CUE salivary peak and the day of the LH surge in 27 cycles measured among 18 female volunteers. Fernando and Betz (1988) disputed the results of the Roumen and Dieben study, claiming that the results had been misinterpreted and that the CUE Ovulation Predictor had not been used correctly. A final study by Jacobs, Blasco, and Sondheimer (1989) measured SER in 21 menstrual cycles with 21 female subjects. They did not use the CUE Ovulation Predictor, but rather the Peak Ovulation Predictor manufactured by Micron Medical Inc. (Boise, ID). They found that the SER occurred 4 to 9 days before the serum LH surge and that the SER had a moderate positive significant correlation (r = 0.61) with the serum LH surge.
Further clinical studies must be conducted on the CUE Ovulation Predictor to clarify its usefulness in determining the fertile period for achieving and/or avoiding pregnancy. No studies have been reported comparing the use of the CUE Ovulation Predictor with a modern method of NFP in determining the fertile period. The specific purpose of this study was to compare the CUE Ovulation Predictor with the self-observation of cervical-vaginal mucus using the Creighton model (CrM) ovulation method in determining the fertile time of the menstrual cycle. As in previous studies, the LH surge in the urine was used as a comparison marker of fertility. The terms that were used in this study are defined in Table 1.
Methodology
Study Design
The design was descriptive comparative. Eleven women with regular menstrual cycles observed their cervical mucus, monitored their SER and VER, and measured their LH surge with a urine assay kit for two consecutive-cycles. Comparisons were made on the first day of fertility (as determined by the cervical mucus and the CUE SER peak) and on the estimated day of ovulation (as determined by the peak day of cervical mucus, the CUE VER nadir, and the urinary LH surge).
Setting
The 11 subjects were taught how to use the CUE Ovulation Predictor and the LH detection kit, and how to observe their cervical mucus by use of the CrM ovulation method in a conference room in a major university nursing center.
Subjects
The subjects for this study were 11 female clients selected (by phone or in person) from the 250 active female clients enrolled in the Marquette University Nursing Center NFP clinic. All 11 of the subjects had menstrual cycles in the normal range of 26 to 35 days, had not been on oral, injectable, or subdermal contraceptives for at least 12 months, and had no known fertility problems. All of the subjects were taught how to monitor their menstrual cycles by daily observation of their cervical-vaginal mucus by the guidelines of the CrM ovulation method. The 11 subjects ranged in age from 22 to 45 years (mean age 32); all were married and had used the CrM for 6 to 96 months (mean use 54 months). Table 2 lists the para and gravida for each subject.
Data Measurement
The urine LH surge was detected by use of the OvuQuick self-test kit (Quidel, Inc., San Diego, CA). The OvuQuick is based on enzyme immunoassay of the LH monoclonal antibodies in the urine. The test has a reported LH sensitivity of 30 mlU/ml. OvuQuick has shown a 98% agreement with other tests in detecting the LH surge (Corson, Ghazi, & Kemmann, 1990). The detection of LH in the plasma or urine is considered by experts to be a standard method for predicting pending ovulation (Corson et aI., 1990; Fehring, 1990; Royston, 1991). This study used the 9-day test kits. A positive result is indicated when a spot activated on the test pad becomes as dark or darker than a reference spot. The peak day of cervical mucus was determined by means of the CrM vaginal discharge recording system (VDRS), developed through research conducted at St. Louis and Creighton University over a 5-year period (Hilgers, 1992; Hilgers, Daly, Hilgers, & Prebil, 1982). The recording system requires that women check for cervical mucus by wiping the outside of their vaginas (the vulvar area) every time they go to the bathroom to void and once before going to bed. The women check mucus for color, stretch, and consistency. Women use the VDRS to rate and chart their cervical mucus in a standardize way. The CrM through use of the VDRS has a reported 98.8% to 99% method effectiveness and a 95% to 98% use effectiveness for avoiding pregnancy (Doud, 1985; Fehring, Lawrence, & Philpot, 1994; Hilgers, 1991). The SER and VER recordings were made by using the CUE Ovulation Predictor described above. The CUE is a battery-operated device with a digital readout. Calibration of the monitor is in arbitrary units proportional to electrical resistance in ohms. The CUE oral and vaginal sensors were tested for accuracy according to the manufacturer's instructions.
Procedure
Once the 11 subjects had read and signed a university-approved consent form, they were given four LH ovulation prediction kits, a CUE Ovulation Predictor with salivary and vaginal probes, and two fertility charts. Each LH test kit provided enough material for the 9 days of testing. Subjects were asked to check their urine twice a day for the LH surge (once in the morning and once in the evening between 10:00 a.m. and 8:00 p.m.) and to record the results. They were also asked to measure their SER and VER once a day in the morning according to manufacturer's instructions and to conduct daily observations of their cervical-vaginal mucus. The results of the electrical recordings, LH detection, and cervical-vaginal observations were placed on fertility charts. Data analysis was accomplished by use of the SYSTAT computer software program (SYSTAT, Inc., Evanston, IL) to determine descriptive statistics and the Pearson product moment correlation coefficients among the LH surge, the SER, the VER, and the peak. The Student's t test was used to determine if there was a statistical difference in the mean number of days of the fertile period as determined by the CUE and the CrM.
Results
Twenty-one of the 22 menstrual cycle charts were usable. One cycle was not included in the calculations because of missing data. All of the 21 cycles had a documented positive LH surge. Table 2 lists, by cycle and subject, the day of the LH surge, the VER, the SER, and the peak. In 20 out of 21 cycles (95% of the cycles), the peak day of cervical mucus and the VER nadir was within ?} 3 days of the LH surge. Likewise, in 19 out of 21 cycles (90.5%), the peak day of cervical mucus was within ?} 3 days of the VER. Table 3 shows the frequency and the percentage of the peak day and the VER nadir in relationship to the LH surge. Statistically, there was a strong positive correlation between the LH surge in the urine and the peak day of cervical mucus (r= 0.71, p < 0.01), between the LH surge and the VER nadir (r = 0.84, P < 0.01), between the LH surge and the SER peak (r = 0.79, p< 0.01), and between the peak and the VER nadir (r = 0.74, P < 0.01).
The fertile period of the CrM as determined by the beginning of the mucus cycle and until 3 full days past the peak day of cervical mucus ranged from 4 to 10 days (mean 6.86, SD = 2.13). The fertile period as measured by the CUE Ovulation Predictor was calculated from 2 days after the SER peak until 3 days past the VER nadir. The CUE fertile period ranged from 3 to 10 days (mean 6.57, SD = 1.43). There was no statistical difference (T= 0.474, p = 0.64) between the number of fertile days in each cycle as determined by the CUE Ovulation Predictor and the CrM ovulation method.
Discussion
The results of this study have relevance to a number of previous studies. Fehring (1990) showed that the peak day of cervical mucus coincided 95% of the time ?} 3 days with the LH surge in the urine. Hilgers et al. (1978) also found in 64 cycles from 24 subjects that the peak in cervical mucus occurred 95% of the time ?} 2 days with the estimated day of ovulation as determined by the LH surge in the serum. The higher percentage in the Hilgers et al. study might be due to the greater accuracy of the laboratory serum LH tests. The current study also found the peak day of cervical mucus to be ?} 3 days within the LH surge 95% of the time, and that the VER nadir fell ?} 3 days within the LH surge. The correlation of the SER with the LH surge (r = 0.79) in the current study was not quite as strong as the SER to LH peak correlation found in the Albrecht et al. (1985) study (r = 0.94) and the Fernando et al. (1988b) study (r = 0.94), but was stronger than that found in the Jacobs et al. (1989) study (r = 0.61). This variation in results might be due to whether urine or serum LH testing was used and to the different types of instruments used to measure electrical resistance.
This study helps to confirm previous results on the accuracy of the CUE Ovulation Predictor in detecting fertility. Albrecht et al. (1985) found that the SER peak occurred 4 to 5 days before the serum LH surge in 90% of the 21 cycles measured. Fernando et al. (1988b) found the SER peak to occur 5 to 7 days before the LH surge in all 32 menstrual cycles. Moreno et al. (1988) found that the SER peak occurred 5 to 11 days before the urine LH surge in 29 cycles. The current study found the SER peak to be 3 to 7 days before the urine LH surge (100% of the time) in 21 cycles measured.
The variation of the time of the SER peak to estimated time of ovulation in the above studies is probably due to the urine being less precise than the serum measure of LH. The LH in the urine does not "peak" as quickly (or as sharply) as the LH in the serum (i.e., the urine LH surge often occurred over 2 days). In the current study, the day of the LH surge was recorded as the last day that a positive reading was found. As a result, there is more variability in the data points. Why Roumen and Dieben (1988) did not find a strong correlation between the CUE SER peak and the estimated day of ovulation is not obvious. However, since they did not use the vaginal recordings, the reference points to determine the SER peak might not have been apparent.
The lengths of the fertile period as determined by the CUE Ovulation Predictor and by the CrM ovulation method were similar (4 to 10 days for the CrM and 3 to 10 days for the CUE), as were the starting and end points. The Cue VER nadir and the CrM peak day are indirect measures of ovulation. The peak and the VER correlation was r = 0.74. The greatest difference between the CrM and the CUE was the markers for the beginning of the fertile period. The correlation between the beginning of the fertile period as determined by the CrM (which is the first day of the mucus cycle) and the SER peak was r = 0.65. The correlation between the beginning of the fertile period between the CrM and the "two day past the SER peak" guideline suggested by Moreno et al. (1988) for use of the CUE in NFP was also r = 0.65. Some of the variability was due to short or limited mucus cycles, long mucus cycles due to continuous mucus, and unexplained short and long CUE SER peak to LH surge ratios. The short SER peak to LH surge (i.e., the estimated day of ovulation) could be a problem if this device is being used as a means to prevent pregnancy, as it has been estimated that sperm can live 3 to 5 days in good cervical mucus. The 3-day prediction period given in some of the CUE cycles would not be long enough to prevent pregnancy.
The conclusion of this research is that the CUE Ovulation Predictor and the CrM are similar in their ability to predict the fertile period of the female's menstrual cycle. Both the CUE Ovulation Predictor and the CrM have some degree of variation in predicting and detecting ovulation. The greatest variation is in the ability to predict the beginning of the fertile period. A caution of this conclusion is that it is based only on a small number of menstrual cycles and subjects. Further research needs to be conducted on the CUE Ovulation Predictor for its potential use in NFP. Although the LH surge is an accepted method for determining optimal time of fertility, the use of a more precise marker (such as serial abdominal and/or vaginal ultrasound to track follicular development) would be recommended. This, however, would take a considerable amount of time and money for the subjects and investigators. Another area of research would be to conduct a prospective use-effectiveness study on subjects trying to avoid and achieve pregnancy using the CrM ovulation method and the CUE Ovulation Predictor simultaneously. Comparisons could then be made on the respective days of the fertile period and the timing of intercourse.
One deficit of the CUE Ovulation Predictor is that it requires an invasive vaginal probe. An objective external marker for ovulation would be better. The CUE, like the ovulation method, has some variation in results when there is continuous mucus due to vaginal infection or vaginal irritation. The CUE Ovulation Predictor also only gives limited knowledge of the menstrual cycle. Women who use the monitor would not be able to determine the quality of their mucus and possible problems such as unusual bleeding and vaginal and cervical infections as readily as would women who use the ovulation method.
At the present time the CUE has potential as an adjunctive device in the learning and use of the ovulation method of family planning. The CUE Ovulation Predictor could provide women who use the ovulation method with another objective marker to confirm their own observations. The CUE could also be used as a tool by an advanced practice nurse (e.g., certified nurse midwife [CNM], adult nurse practitioner [ANP], OB/GYN) specializing in women's health care. At this time the CUE should be used only as an adjunctive device with the guidance of competent practitioners who are knowledgeable about the recommended protocols of the CUE Ovulation Predictor.
Notes
- Address correspondence to Richard J. Fehring, DNSc, RN, CNFPP, Associate Professor and Coordinator-Advanced Practice Nursing: Adult, Marquette University, College of Nursing, Emory T. Clark Hall, P. O. Box 1881, Milwaukee, WI 53201-1881.
- Richard J. Fehring DNSc, RN, CNFPP, Associate Professor Marquette University College of Nursing Milwaukee, Wisconsin.
References
- Albrecht, B., Fernando, R., Regas, J., & Betz, G. (1985). A new method for predicting and confirming ovulation. Fertility and Sterility, 44(2), 200-205.
- Corson, G., Ghazi, D., & Kemmann, E. (1990). Home urinary luteinizing hormone immunoassays: Clinical applications. Fertility and Sterility, 53(4), 591-601.
- Corson, S. L. (1986). Self-prediction of ovulation using a urinary luteinizing hormone test. Journal of Reproductive Medicine, 31(Suppl.), 760-763.
- Doud, J. (1985). Use-effectiveness of the Creighton model of NFP. International Review of Natural Family Planning, 2, 54-72.
- Fehring, R. (1990). Methods used to self-predict ovulation: A comparative study. Journal of Obstetric, Gynecologic and Neonatal Nursing, 12(3), 233-237.
- Fehring, R. (1991). New technology in natural family planning. Journal of Obstetric, Gynecologic and Neonatal Nursing, 20(3), 199-205.
- Fehring, R., Lawrence, D., & Philpot, C. (1994). Use effectiveness of the Creighton model ovulation method of natural family planning. Journal of Obstetric, Gynecologic, and Neonatal Nursing, 23(4), 303-309.
- Fernando, R., & Betz, G. (1988). Ovulation prediction by monitoring salivary electrical resistance with the CUE fertility monitor. Obstetrics and Gynecology, 22(2), 282-283.
- Fernando, R. S., Regas, J., & Betz, G. (1988a). Physiological mechanisms associated with ovulation prediction using the CUE Ovulation Predictor. Human Reproduction, 3(4), 413- 417.
- Fernando, R. S., Regas, J., & Betz, G. (1988b). Ovulation prediction and detection with the CUE ovulation predictor. Human Reproduction, 3(4), 419-424.
- Hilgers, T.W. (1991). The medical applications of natural family planning. Omaha, NE: Pope Paul VI Institute Press.
- Hilgers, T. W. (Ed.). (1992). The ovulation method of natural family planning. Omaha, NE: Pope Paul VI Institute Press.
- Hilgers, T. w., Abraham, G. E., & Cavanaugh, D. (1978). The peak symptom and the estimated time of ovulation. Obstetrics and Gynecology, 52, 575-582.
- Hilgers, T. W., Daly, D., Hilgers, S., & Prebil, A. (1982). The ovulation method of NFP. Omaha, NE: Creighton University NFP Center.
- Jacobs, M. H., Blasco, L., & Sondheimer, S. J. (1989). Ovulation prediction by monitoring salivary and vaginal electrical resistance with the peak Ovulation predictor. Obstetrics and Gynecology, 73(5), 817-822.
- Moreno, J. E., Weitzman, G., Doody, M., Gibbons, W., Besch, P., & Goldzieher, J. (1988). Temporal relation of ovulation to salivary and vaginal electrical resistance patterns: Implications for natural family planning. Conception, 38(4), 4-7-1.
- Roumen, F., & Dieben, T. (1988). Ovulation prediction by monitoring salivary electrical resistance with the cue fertility monitor. Obstetrics and Gynecology, 71(1), 49-52.
- Royston, P. (1991). Identifying the fertile phase of the human menstrual cycle. Statistics in Medicine, 10(2),221-240.
- Seibel, M. (1986). Luteinizing hormone and ovulation timing. Journal of Reproductive Medicine, 31(Suppl.), 754-759.
Appendix
Table 1
Definition of Terms
- Salivary electrical resistance peak (SER) -the first high value of the CUE Ovulation Predictor when using the oral probe occurring on or after the start day of measurement followed by 2 days of lower readings. The SER occurs about 5 to 11 days before ovulation.
- Luteinizing hormone (LH) surge -the highest level of LH after the beginning of the menstrual cycle as determined by a positive reading on a urine assay test kit. The LH surge occurs in the urine about 12 to 24 hours before ovulation (Corson, 1986; Seibel, 1986).
- Vaginal electrical resistance nadir (VER) -the lowest reading on the CUE Ovulation Predictor when using the vaginal probe to detect electrical resistance readings.
- The peak day of cervical-vaginal mucus (peak) -the last day of observable mucus in the woman's menstrual cycle that is either clear, stretches more than an inch, and/or has a lubricative sensation.
- Regular menstrual cycle -a cycle that ranges from 26 to 35 days in length in women who have no known fertility problems.
- The fertile period -defined by the Creighton model (CrM) ovulation method as the beginning of the observable cervical mucus (the mucus cycle) until 3 full days past the peak. The fertile period as measured by the CUE Ovulation Predictor was calculated from 2 days after the SER until 3 full days past the VER.
Table 2
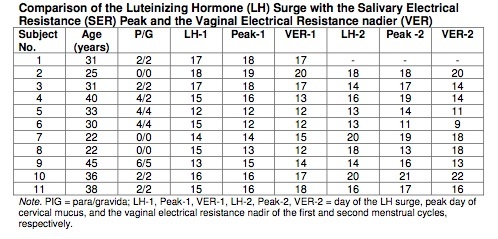
Table 3
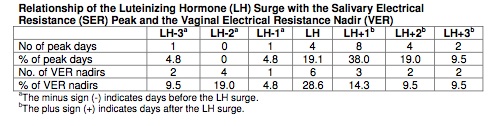
Figure 1
Image unavailable due to third-party copyright restrictions. Please see definitive published version to view image.
Article copyrights are held solely by author.
[ Japan-Lifeissues.net ] [ OMI Japan/Korea ]